Surface Plasmon Resonance Spectra
In UV/Vis for Nano Particles, I read about how UV-Vis spectroscopy can be used to analyze gold nanoparticles. Here are some notes about surface plasmon resonance (SPR) spectra, which are key to understanding the optical properties of these nanoparticles.
Why SPR Spectra Matter
- Non-destructive characterization: Can determine particle properties without electron microscopy (see UV-Vis vs TEM comparison)
- Real-time monitoring: Can track synthesis, aggregation, or functionalization
- Quality control: Ensures batch-to-batch consistency
- Sensing applications: SPR shifts can detect molecular binding events
Surface Plasmon Resonance Spectra
Nano particles have a surface plasmon resonance (SPR) peak in the UV-Vis spectrum, which is sensitive to their size, shape, and environment. (Note: For nanoparticles, this is more precisely called LSPR - Localized Surface Plasmon Resonance.)
Surface Plasmon Resonance is a collective oscillation of free electrons at the surface of metallic nanoparticles when they interact with light. For gold nanoparticles:
- Physical Phenomenon:
- When light hits a gold nanoparticle, the electric field causes the free electrons to oscillate collectively
- This creates a resonance condition at specific wavelengths
- The nanoparticle strongly absorbs and scatters light at these wavelengths
- Visual Effect:
- This is why gold nanoparticle solutions appear red/pink (for small spheres) or blue/purple (for larger particles or rods)
- The color depends on which wavelengths are absorbed
- This coloration is what makes gold colloids visually distinctive
SPR spectra are UV-visible absorption spectra that show how much light is absorbed by nanoparticles at different wavelengths. They typically display:
- Key Features:
- Absorption peaks: Show maximum absorption at the resonance wavelength
- Peak position (λmax): The wavelength of maximum absorption
- Peak intensity: How strongly the particles absorb
- Peak width: Related to particle size distribution
- Information Content:
- Size: Larger particles have red-shifted (longer wavelength) peaks
- Shape:
- Spheres show single peaks (~520-550 nm for gold)
- Rods show two peaks (transverse and longitudinal modes)
- Concentration: Higher concentration = higher absorption intensity
- Aggregation state: Aggregated particles show broadened, red-shifted peaks
Examples from Examples from paper
The paper “Quantitative Analysis of UV–Vis Spectra of Gold Nanoparticles Using Machine Learning” by Pashkov et al. (2021) provides examples of SPR spectra for gold nanoparticles: Pashkov et al. (2021)
Spherical Gold Nanoparticles:
- 5 nm particles: peak around 515-520 nm
- 50 nm particles: peak around 530-535 nm
- Larger particles (>80 nm): peaks can shift beyond 550 nm
Gold Nanorods:
- Show two distinct peaks:
- Transverse peak: ~520 nm (similar to spheres)
- Longitudinal peak: 600-1200 nm (depends on aspect ratio)
- Higher aspect ratio = more red-shifted longitudinal peak
- Show two distinct peaks:
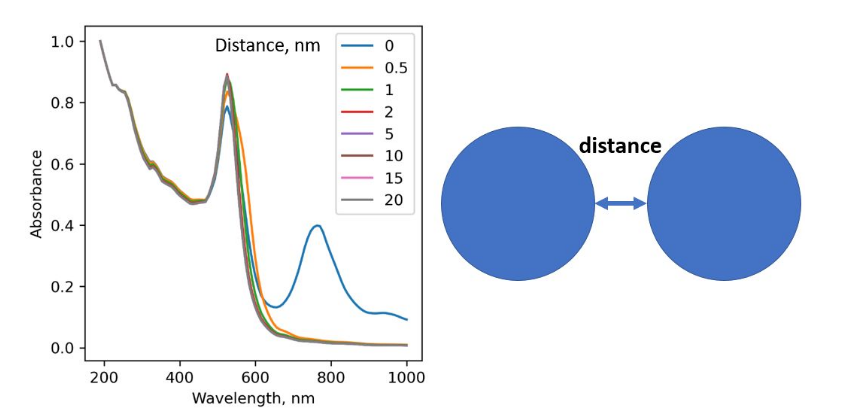
Surface Plasmons at Large Separations
In a typical gold nanoparticle colloid, the separtion between particiles is in the order of 10 μm, as I showed here. This is much larger than the particle size, so particle-particle interactions are negligible in typical UV/Vis measurements.
The authors of (Pashkov et al. 2021) verified that the particle-particle interactions are negligible