Extracting data with Plot Digitizer and LineFormer
Extracting line plot data
There is a great deal data in papers, that is only accessible through plots.
Figure Figure 1 shows a plot from a paper that I wanted to extract data from.
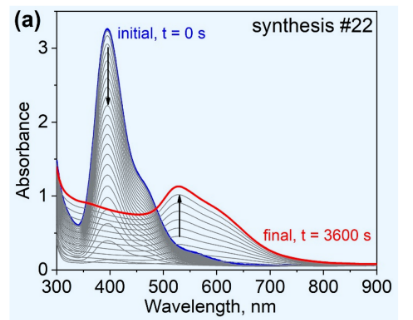
The many overlapping lines may present some difficulty.
Nevertheless I am going to try some tools to extract the data from this plot.
Plot Digitizer
Many papers state using Plot digitizer for extracting data form plots. I tried it out first, see Figure 2.
I expected lines would be traced automatically, but it requires clicking; a lot of clicking. First the location of the axis need to be selected by the mouse. Then points on plot can be clicked. These present data points.
For the plot in Figure 1, it will be difficult to create good estimates in the dense overlapping regions. Moreover, with about ~30 curves and 100 points per curve we would need spend a great deal of time.
LineFormer
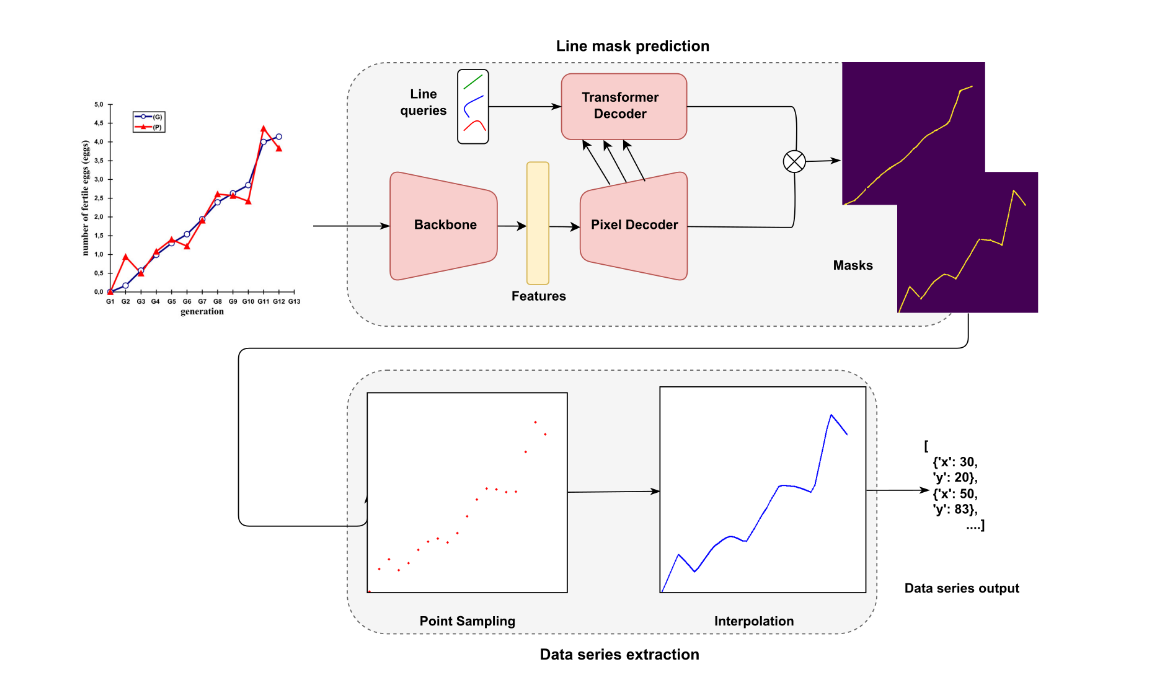
There must be a faster way to extract these lines. A search brought up LineFormer. The paper Lal et al. (2023) phrases line extraction as a segmentation problem.
Results
The heavy transformer model does not perform as I hoped:
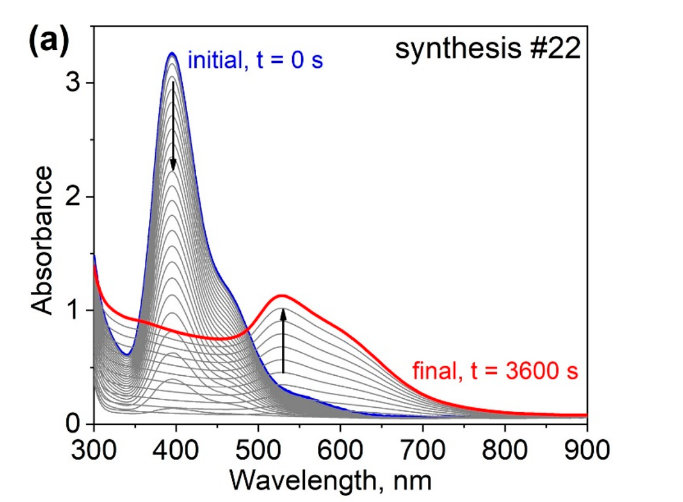
Most curves are not captured, and those curves captured are not very precises.
Modifications
There are a couple of detection parameters that we can modify in search for better detection results on fine lines:
- Lower IoU threshold
- Higher max detections per image
- Larger image resolution
- Disabled low score filtering
We expect that lines can be tracked more precisely, while adding some false detections.
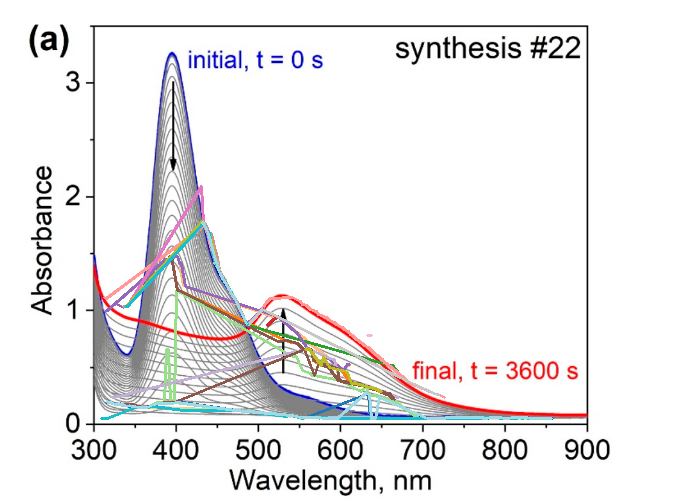
Figure 5 shows the result of these modifications. While we have more spurious detections, the quality of the true positives did not improve.
Next steps
Next I will try to extract the lines making use of old-fashioned computer vision and exploit the fact that we have a family of smooth curves.